Posted in Inquiry, Research, Search, TC@Columbia

Teaching Students How to Research for Understanding with Technology

Searching for information on the Internet can be extremely challenging for our students. This is widely due to the sheer amount of information that is currently available out there. A lot of teachers assign projects that have students conduct searches, whether using a paid database, or Google. Many teachers that I know tend to equate searching for information with learning. They believe that if students are searching for their information online that they will naturally make sense out of what they find. Research however paints a different picture. When students search for information, they tend to search for predetermined answers and are not comprehending or reflecting on the meaning of what they have found; they are simply searching for the one answer that the teacher is looking for (Fidel et al., 1999).

Unfortunately searching, or what teachers often call research projects, often ends with the harvesting of the data, rather than extending into the next stage of the process. Searching for information is essentially meaningless without a deeper purpose. With this concept of “researching” in mind, let’s consider what it takes to teach students how to research for understanding with technology and become more competent researchers in the process.

A “Research” Project

Eighth grade students were recently assigned a research project about an historical figure. The students were required to use one of two paid research databases and were not allowed to use Google to collect their data. Once students had located their data they were instructed to create a PowerPoint about the historical figure and use only the information that they gathered from the paid research databases as their primary source of data. Once completed the students were asked to present their historical figure to their class.

The above is the general framework that many “research” projects take on. The students are instructed to gather their data from a source, or sometimes sources, and then they present on their data, usually in the form of a PowerPoint or Prezi presentation. The problem with this framework is that unless this is a Ctrl-C + Ctrl-V lesson, there is no learning for understanding taking place. That is because this lesson assumes that researching (data collection) is a one step process.As you can see from the diagram, under this framework of research there is no way to know if the students are understanding what they are collecting and then presenting on. This framework, as designed, assumes that the students have had the time to analyze the data for being (a) accurate, (b) factual and (c) up to date. In order for there to be a learning outcome the students have to have ample time to reflect upon the data in order to make meaning in order to understand what the data is telling them (Jonassen, 2011). This lesson, currently designed, fails to accomplish that outcome by ignoring crucial steps in the research process.

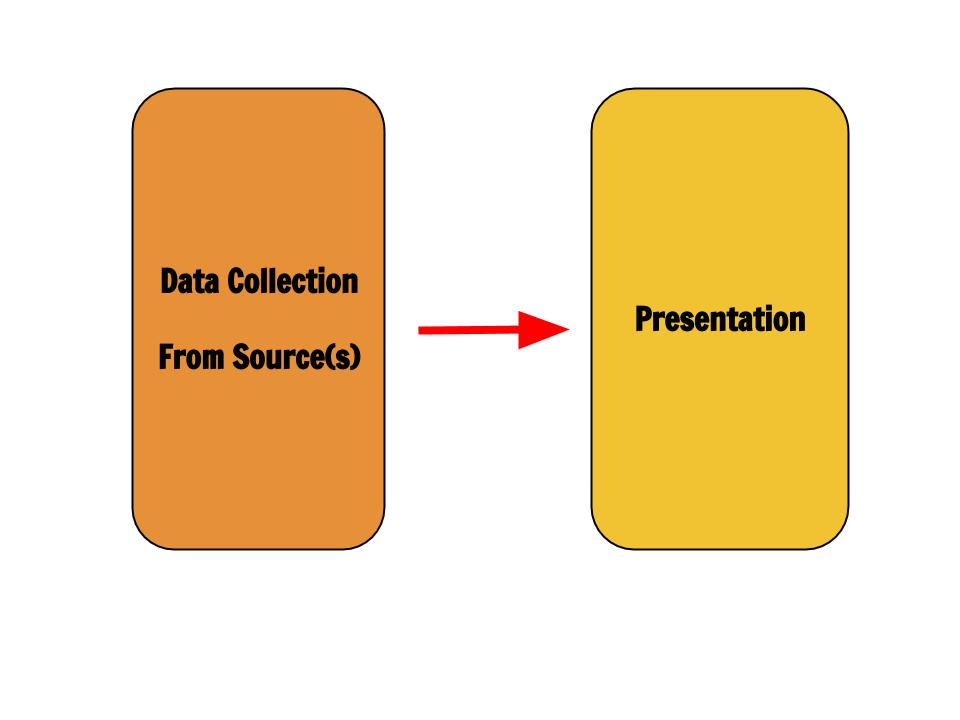
What Is Understanding

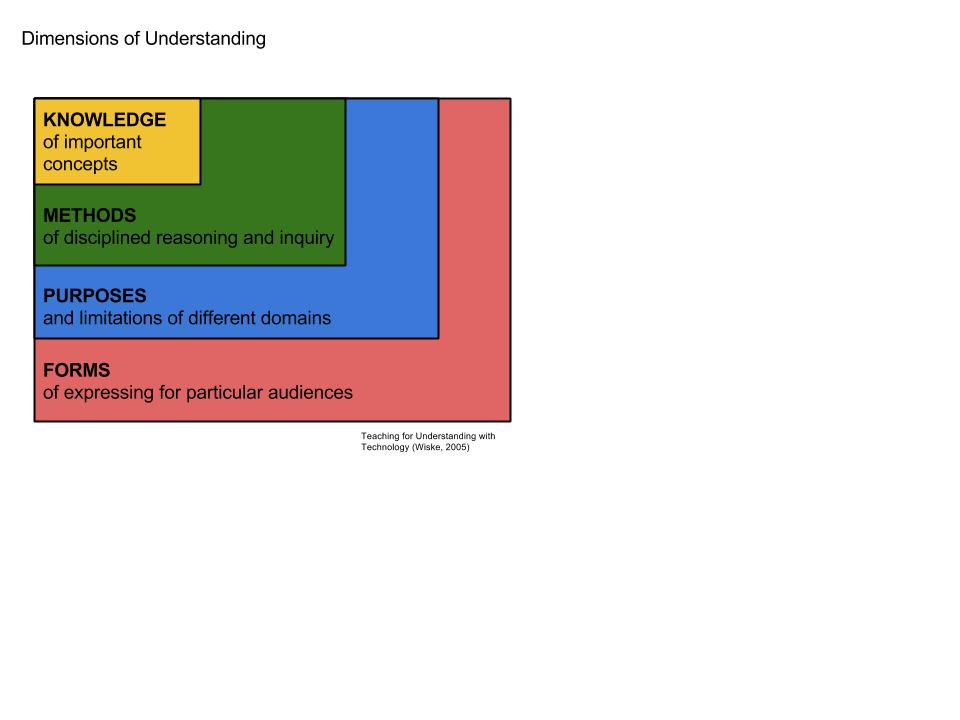
Understanding is a flexible performance capability that encompasses four dimensions that take into account that learning is an active process, not simply a matter of absorbing information or practicing basic skills. Such performances require learners to stretch their minds, to think using what they have learned and to apply their knowledge creatively and appropriately in a range of circumstances (Wiske, 2010). The four dimensions of understanding are:

Domains of Understanding

Example

Knowledge of important concepts

Research is a multi-stage activity that requires searching for data from multiple sources of information

Methods of disciplined reasoning and inquiry,

Data sources should be triangulated; compared and contrasted before being used

Purposes and limitations of different domains

Information sources use hierarchies when displaying results of searches

Forms of expressing understanding for particular audiences

Demonstrating understanding of information by performance using multiple tools that are appropriate for various audiences

(Wiske, 2005).

Understanding Searching With Technology

Equally important to this discussion is the knowledge of how search engines work. First, a search engine is just a vehicle for the retrieval of data from a database or network. Google is the most popular example of a search engine, however the paid research databases like EBSCO and GALE are also search engines. The database that is queried by the user requires first, that information be gathered from around the web, and second, that this collection of data be processed in such a way that a page’s relevance to a particular set of keywords may be determined (Halavais, 2009).

The most basic form of processing that is common to almost every modern search engine is the extraction of key terms that are used to create a keyword index for the web by an “indexer” (Halavais, 2009). Like a book index, information about which words appear on any given page are reversed so that the searcher is given pages that contain the keywords that they are searching for. Once the set of results are generated, they are ranked in some way to provide a list of topics that present the most significant “hits” first (Halavais, 2009). The most common display of search results is as a list with a brief summary, or snippet of the page that contains your keywords.

A problem that arises in research projects with students is that they tend to click on the first few results on a list. The results of a search are usually ordered by relevance of the page which uses among other things how many times your search words are found on that page and how many other pages link to the page. The problem with this is that relevance does not always equal reliable. Researching requires multiple sources of information, not just what the search engine deems to be the most popular for your search.

Stages of Research

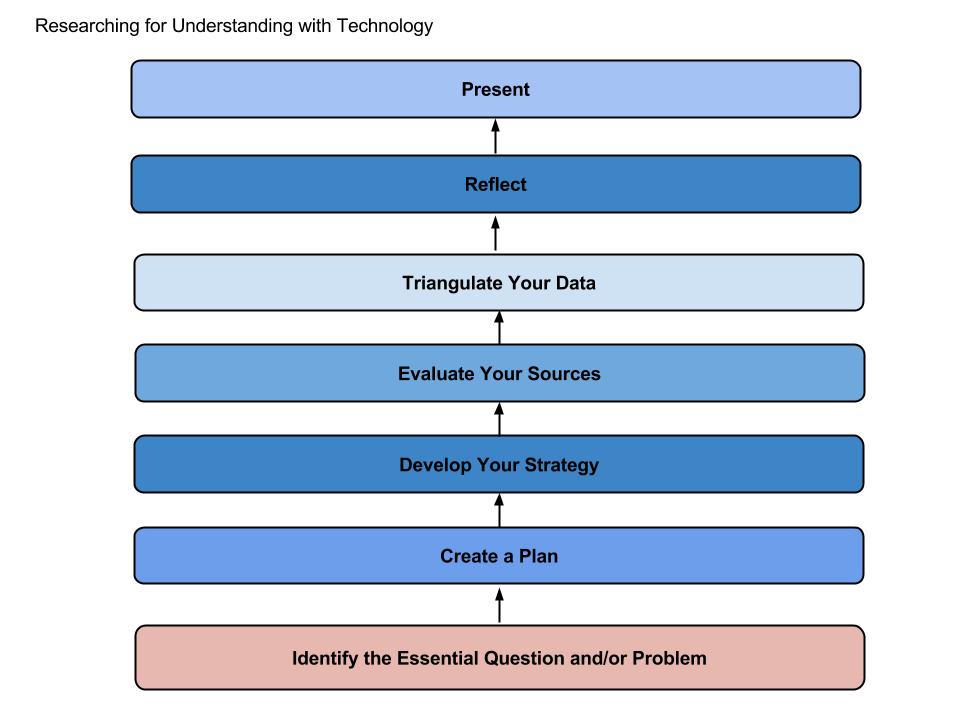
Researching is the act of solving problems by asking questions. In order to learn from the data being sought, students must have an intention to find information that will help them solve that problem (Jonassen, 2011). Students therefore must have a purpose other than fulfilling the requirements of the assignment. Researching requires at least a four-step process:

1. Plan

2. Strategize

3. Evaluate

4. Triangulate

(Jonassen & Colaric, 2001)

Research Process

PLAN – Identify what the problem is and the questions that you are going to ask.

STRATEGIZE – The route that you are going to take to search the web for information about your questions.

EVALUATE –  The sources of data that you are  using for credibility, accuracy and currentness.

TRIANGULATE – Compare your sources of data against one other.

Putting This All Together

Teaching students how to research for understanding requires multiple-steps. This framework allows students the time to both evaluate where the data is coming from, compare the data against each other, reflect in order to make meaning and then present on their understanding of the data and information gathered. If we use the historical figures research project mentioned earlier, this framework would break that project down as follows:

Stage

Activity

Identify

Student selects historical figure and asks how they were important to American History

Plan

Student identifies how they answer how their selected historical figure and their answer to the essential question(s) and/or problem

Strategize

Student selects databases they will use to gather data that supports their answer to the essential question of their historical figure’s importance to American history.

Evaluate

Student evaluates their sources of data and identifies the limitations of them.

Triangulate

Student compares data that was collected from their sources and looks for discrepancies and similarities.

Reflects

Student reflects upon their data and how they have used it to support their answer to their essential question.

Presents

Students selects the appropriate tool to present their data to an audience.

Conclusion

Equipping our students with the skills to search effectively is the first step in using the Internet as a source of information. The above framework is structured to scaffold students throughout the research process, beginning with identifying the topic that are both meaningful and relevant to them, the learner. This inquiry-based process emphasizes metacognition, with students reflecting on the research process itself. This allows students to engage in learning that has significance and value. Technologies can support and extend this value to students by allowing them to investigate, solve problems, access, manage and evaluate information that they find. These skills are vital for the information rich world that they are growing up in and when learned will help them to become better consumers and producers of information and knowledge.  

Works Cited

Colaric, Susan, and David Jonassen. “Information equals knowledge, searching equals learning, and hyperlinking is good instruction: Myths about learning from the World Wide Web.” Computers in the Schools 17.3-4 (2001): 159-169.

Fidel, Raya, et al. “A visit to the information mall: Web searching behavior of high school students.” JASIS 50.1 (1999): 24-37.

Halavais, Alexander. Search engine society. John Wiley & Sons, 2009..

Jonassen, David H. Meaningful learning with technology. Pearson/Merrill Prentice Hall, 2011

Wiske, Martha Stone, and Lisa Breit. Teaching for understanding with technology. John Wiley & Sons, 2010.


Posted in Inquiry, Mashups, Tour Bulder

4 Inquiry-Driven Project Ideas Using Google’s Tour Builder

There are a lot of great tools out there that have more than one use. One of my favorite tools is Google’s Tour Builder, a Google Maps infused interface that allows the user to create tours. But did you know that you could also use Tour Builder to support inquiry-driven learning? Tour Builder gives students an interactive way to present their learning in a way that is a lot more engaging than a PowerPoint or Prezi presentation. Here are four of my favorite ways to use Tour Builder with students.

Click HERE to view my example Tour Builder

Multimedia Letter 

What would it be like to be a Private in the 4th Infantry Unit of the U.S. Army in 1944? In this Tour Builder example students research this question and create a multimedia letter experience around the event, or book that they are reading. In my example I use WWII and begin on June 6, D-Day, on Utah Beach as part of Operation Overlord. My letter takes place 3 days later, after the Allied forces had successfully taken the beaches of Normandy, France.

As students research the battles and events of WWII they add other locations that the 4th Infantry fought and continue to write letters to explain the events and what their “soldier” experienced throughout the many battles of the war. To add to the experience I have included a YouTube video that uses histrocial footage from D-Day. If you have more time you could have the students create their own multimedia and add that to the tour instead.

Variations: The multimedia letter could also be written around other historical events, or even books that the students are reading. Students can assume the role of a character from the book, or an actual historical figure and create an interactive tour that immerses the viewer into the world.

Trends

I love Google Trends for inquiry-driven projects. This project blends Trends and Tour Builder together. In my example I use Google Trends to see how popular the search term “pizza” is. Trends gives me data by country and state/provence but it doesn’t tell me why.

Currently the United States leads the world in searches for pizza and the state of Minnesota clearly loves searching for pizza. Canada comes in 2nd as a nation in pizza searches. In my tour I could continue to add more countries and inquire as to why they are searching for pizza. In a more scholarly project I may use Trends to see the search data of other words, like democracy and socialism, or racism and build a tour that looks where these terms are popular and not popular and why.

Getting to Know Us

I currently teach on a U.S. Navy base in Sasebo, Japan and next year I will be working in an International School in Frankfurt, Germany. Our kids have lived all over the world. In this tour example I showcase my favorite place that I have lived and why. If I were doing this with students I would have them add their favorite cities to the tour as well.

Once all of the students have added their cities I would have them interact with the tour and learn more about their classmates. I could add a Google Doc to this project and have the students write what they have in common with their classmates, or what they would like to learn more about them. This is an inquiry-driven lesson into getting to know each other. It could also be expanded later on to include historical/major events that have happened in the city.

Variation: If you teach in a location where the students either haven’t lived in other cities, or traveled to other locations you could have your students add their favorite park, or place to visit in their own city.

Lit Tour Journal

In this tour the students use the locations of a book to write journal entries on the major events of the book, or to write from the persective of one of the book’s characters. In my example I use the book The Hobbit to show how with a little imagination you can include fictional locations as well.

Non-Displayed Examples

Tour Builder is great for just about every subject. If students are learning about distance they could build a tour that takes us on a journey of a certain amount of miles. If the students are learning about biomes the tour can take us from one biome, like a rainforest, or another.

Because Tour Builder allows us to integrate other forms of media we could take our tours to new levels by including podcasts, Google Docs, videos and even links to websites or blogs. Tour Builder would also make for an amazing Choose Your Own Adventure that blends together different media and art forms to really make the experience unique.

Posted in Google Plus, Hashtag, Inquiry, Search, Social Media

How a Common #Hashtag System Could Change Education for Students

Social media is not about the exploitation of technology but service to community.
– Simon Mainwaring

#おはよう
#buenosdías
#좋은아침
#bonjour
#goodmorning

The hashtag has become one of the most recognizable symbols of our time. Much like the peace sign, Apple, or Batman logo. When you see the hashtag you instantly know what it is and how it is being used. This only became clear to me as I stood in line for a crepe at my favorite mall in Nagasaki, Japan. While standing in that long line I began looking at all of the signs to the various boutiques. That’s where I saw it. The hashtag. Only what followed was not recognizable to me. What followed the hashtag was something written in Japanese. That’s when it hit me. The hashtag is a global phenomenon. And there’s power in using it in K12 academics.

The Power of a Hashtag

The five hashtags that begin this thought are, as you probably guessed, good morning in 5 different languages (Japanese, Spanish, Korean, French and English). If you search with any of the five hashtags on Twitter, or G+ you will see how others have tweeted, or posted using that hashtag. When I searched there are pictures of sunrises from various parts of the world, breakfast plates, clouds in the sky, a cat (of course) and a Japanese teenager’s selfie of her in her school uniform on her bed in a rather interesting position that I’m pretty sure her father would not approve of.

Commonly Used Hashtags for Academics

Educators already use commonly accepted hashtags when they tweet, or post to G+. An education conversationalist uses #edchat, an educational technology conversationalist uses #edtechchat, Google Apps enthusiasts use #gafe and educators in Iowa use #iaedchat. If we began using commonly accepted hashtags with our students the possibilities would be nearly endless.

If I were teaching 3rd multiplication I could use #3rdgrademultiplication to search for content, or even better to connect with other classes that are learning the same thing at the same time as my class. We could have challenges, either through Google Hangouts, or Skype. We could conduct projects and spin-off the hashtag for our own purposes. We could organize everything by using the hashtag and make it simple for our learners to search for and thus find later when they need it.

With older students learning more about #formsofgovernment they could organize content and resources around their hashtag. They could also use the hashtag to connect with other learners in their age group who are studying the same thing. Projects could be created, but even better students could offer peer feedback and assistance.

The best part about using the hashtag is that it is archived and future learners searching by using that hashtag can then tap into the content, resources, or peer assistance and feedback as well at later dates and times.

We Have to Start Students Early

Daily calendar is a widely used strategy for teaching the days of the week, basic counting, weather and using appropriate symbols in early childhood education classrooms. Imagine if early childhood teachers used #dailycalendar to organize their content around. We could begin to teach our young learners more about the world in which they live. World weather and thus graphing, or charting, could be added by teachers gathering the daily weather that other teachers from around the world are sharing through the use of the hashtag. Global connections could be made through this. Teachers could also search the archive of past uses of the hashtag and gather weather data to create charts, or graphs and have their young learners make predictions before they reveal the actual answer.

This is a lot more interesting that just searching weather.com. Because there is a teacher, and class for that matter, on the other end of that hashtag tweet, or post, the students can begin to form global bonds and thus begin the early stages of learning more about digital citizenship. The earlier we teach this the more likely our young learners are to become digital leaders by the time they hit middle, or upper levels of their education. Other benefits of this could include global pen pals and teacher connections. Imagine using other commonly accepted hashtags for your age group to connect on other projects, of if you are like me, build thematic inquiry-driven units around.

Hashtags for Experts

By developing a commonly accepted and thus used hashtag system educators in the K12 space could encourage experts and other scholars to engage with our students around the content that they specialize in. If I am having my students learn about #formsofgovernment politicians, or scholars of government could follow the hashtag and participate in the conversation, share their own resources, or content, or even better connect with the class/student(s) that are learning about the subject.

Hashtags for Inquiry-Driven Research

Future learners would also benefit by this by being able to search the hashtag for answers to their own questions.  As with any learning that happens online, students would have to learn if the source is reputable, and reliable. Previous tweets, or posts from the expert could be examined as well as links in their Twitter masthead, or through Google searches of the person.

The hashtag also presents a way for learners to engage with primary sources. Hashtags are already being used around historic events. #ArabSpring, #syria, #japantsunami are just a few. Chances are if something major is happening in the world that there is a hashtag for it. Learners can search for the hashtag and begin to read first hand accounts, often in real-time as the event is happening. And again, all of this is archived and can be accessed at any point in the future. Search #japantsunamai and you’ll see photos from the scene of Japan’s March 2012 tsunami if you are willing to go back in time to view them.

Where Do We Begin?

At the beginning of course. Start by creating a hashtag for the content in which you are going to teach. If you blog post an article about your newly created hashtag. Tweet it, post it, do everything you can to spread the word. Encourage other educators that you know to use your hashtag for that specific content and to create their own new hashtags for other specific content. Have them blog it, or you can as well, tweet it, post it, pin it, share it, whatever. The goal is to get your hashtag out and used. The more people who know about it and begin to use it the more likely it is to stick and become a commonly accepted and used hashtag.

You will also have to use the hashtag to connect with other users of that hashtag. Think about the age group that you teach and are targeting. If younger this makes a great circle time teacher-lead activity.  If older it makes for a fantastic inquiry-driven project. I suggest starting small, one concept, one hashtag. I also suggest paying attention to other educators sharing their hashtags and taking note. If you don’t have the time to write them down believe me there will be a rock star out there that will and they will share the academic hashtags that they encounter. Hey, what an awesome use for a collaborative Google Sheet.

Endless Possibilities

As I mentioned earlier, the possibilities are truly endless. If K12 educators began to develop and then use a commonly accepted hashtag system you would essentially be cataloging the Internet. Not only would you be benefiting the current generation by creating an easier way to connect, gather and share, but you would be also giving future generations an easy way to look back and see how we learned and how we used social media to deepen our own understandings, connect globally and become responsible digital leaders

Posted in Inquiry

Digital Storytelling with Google’s Cultural Institute

Storytelling reveals meaning without committing the error of defining it.
– Hannah Arendt 

Creative expression, regardless of what subject you teach, is in my view a great way to have students make abstract connections to the concrete skills that they are learning. When I taught math there was always a place for students to create digital stories of the concepts that they were learning. I usually made this lesson a tent pole lesson, which were my lessons that happened in the middle of the unit. I found that these stories often painted a very clear picture of whether or not there was any learning happening. They become an important piece of my assessment puzzle.

There are so many tools and different ways to have students work with digital storytelling now that it can be hard at times to seperate the good from the not so good. I generally recommend that the tool should not get in the way of the outcome, which in this case would be a story. The tool should be easy enough to use that any age, or ability level, can do so. One such tool that I have had success with using is Google’s Cultural Institute.

Really? Google Has  Cultural Institute?

Google’s Cultural Institute combines the efforts of the Art Project, World Wonders and Historic Moments. It’s full of really high resolution photographs that allow you, on some art, to zoom all the way into the brush stroke. You can use the CI to do a virtual field trip of some of the best museums in the world by clicking on the Museum View dude (Streetview dude in Google Maps). My favorite Museum View is the White House. It actually gives you the feel of walking through the actual White House and looking at all of the amazing works of art that they have.

A newer feature of the CI is the ability to combine your saved artworks into your very own gallery. You can add text (200 characters, slightly more than a tweet), or link to a YouTube video. The CI also allows you to make your gallery open to the public. Because there is so much contained here the possibilities are quite endless on how you can use the CI with students.

It’s Google, So Search On

Since the CI is a Google product you have the ability to search. If you are looking for specific types of art, explore the artworks and search for what you are looking by medium.

CI_Search

When you do this you begin to see just how much they have in their collection and how powerful of a learning tool this is for students.

Early Childhood Meets Art

My 4-year old son is very curious about art. Together we have been exploring some of the galleries looking for pieces that interest him. We began saving the blue pieces and then placed his favorite ones into a gallery. I asked him why he liked these pieces and he said that they made him feel happy. With my help we typed up one sentence stories and created Blue Happiness which we have made public.

Math Stories

When I taught math I would have my students write their own stories. It was a way for them to express themsevles and for me to assess whether any learning was transfering. With the CI students have a very easy tool, access to amazing photos and artwork to work with as they write their own math stories. If 200 characters is not enough space you can use the text box to paste a link from a shared Google Document or use YouTube to record a selfie-narration.

Geometry

My favorite project with my geometry students was to look at art and then identify various geometric concepts happening within the art. With the CI I can now incorporate Google Draw into the lesson. Have students identify geometric concepts that they are learning from the pieces of art and then use Google Draw to explain those concepts back. Instead of text just paste the link to the drawing so that those viewing the gallery can see the visual explanation.

Indiana Jones and the Google

When learning about new cultures, or countries, why not have students use the CI to identify artifacts and create an adventure story with them. For more than 200 characters link a Google Doc to each of the visuals. For more advanced students have them create a “choose your own adventure” story that links together several different galleries that the reader can move through. Use the various types of art to create artifacts that the reader chooses locations to search. Have the students research the artifact and include some interesting facts about it, where it came from and who made it right in the story.

A Picture is Worth…

How a picture is framed, captioned, and distributed can blunt, heighten, or pervert its effect. Are we being informed, or manipulated? Reassure or enraged? The Historic Moments section of the CI is filled with many histroic photographs. It is like looking back at the past through the lens of those that experienced it. Have students create a gallery that answers the questions above. If you are studying about a war you can also have students answer if war is horiffic, or a heroic adventure. Have them play with the captions to change the effect of the photo.

What Does Art Say About the Culture?

Instead of just reading about a culture, or country that the students are learning about, have them explore its art. Here’s a gallery of early 20th century art from Japan. What do the images, colors and artifacts tell us about them? Have students locate art from the country or culture they are learning about and create a gallery that connects the concrete with the abstract.

Go Ahead, Get Yourself Lost

You could spend days exploring the CI and all that it has to offer. I encourage you to do so. Play. Zoom. Save. Create. Reflect. Write. Have fun!

Posted in Inquiry, Research, Search, Trends

Teaching Students How to Conduct Inquiry-Driven Research

If we knew what it was we were doing, it would not be called research, would it?

– Albert Einstein

Teaching Students How to Conduct Inquiry-Driven Research

It always starts with a question. Most of the time there is a simple answer to that question.

  • What time does the store open?
  • How do I get to that city from here?
  • What was the name of that actress that played in that movie?

But a lot of times our questions don’t have an easy answer to them. That is an answer that can be found within one, or two searches. For these answers to our more complex questions we need to know how to search, or what most call research. But research is really nothing more than asking a question that requires the person, or persons who are asking the question to search for an answer (Jonassen, 2011). And what usually happens, is that one question leads to another. The goal is to collect as much data to draw and then support a logical conclusion, or answer, to your question(s) (Jonassen, 2011).

Research as Meaningful Learning

Technology that is used to support meaningful learning that engages and facilitates deeper levels of thinking does not include using technology as delivery vehicles (Jonassen, 2011). Meaningful learning with technology:

  • Supports knowledge construction for both representing learner’s ideas, understandings and beliefs as well as for producing organized, multimedia knowledge bases by the learner.
  • Is a vehicle that supports the exploration of knowledge by supporting and constructing information to compare perspectives, beliefs, and worldviews. (Jonassen, 2011).

Searching for Information requires the learner to acquire multiple skills. Effective information gathering from the Internet combines expertise in searching for information and also assessing the worth of that information in order to organize it into something that is usable (Jonassen, 2011). Therefore, finding information on the Internet can be extremely challenging to students because of how much information is available.  Teaching students how to research for that information supports their exploration of knowledge and allows them to compare and contrast various perspectives, beliefs and worldviews on that information (Jonassen, 2011).

Teaching Research to Students

When we teach students how to search for information on the Internet it is important to consider three very important questions:

  • How do people enter items into a search engine query box?
  • How do they interpret those results?
  • How will that information be used? (Halavais, 2013)

Therefore this lesson on teaching students how to conduct inquiry-driven research addresses those questions and also seeks to educate the learners on how search engines work. The goal is to increase the learners search engine literacy by  advancing not only their searching skills, but also by educating them on how to compare the information that they are receiving through triangulation (Halavais, 2013; Jonassen, 2011).

A Question of Great Importance…to Most Teenagers

Who is more popular, Justin Bieber, Miley Cyrus, or Beyoncé?

I love questions like this. You can’t just Google the question to find the answer to it. Believe it or not but this is a question that will require deep inquiry and research. Yes, we’re going to Google it. But we’re going to Google it in a way that teaches students how to conduct inquiry-driven research in which they will collect data that they will then use to draw and support a conclusion from.

Let Us Look at the Trends?

Popularity can be so subjective on its surface. However we can look a little deeper and agree that the more popular something, or someone in our case, is the more that people will be searching for it. And we can all agree that the place most people search for something is in a search engine. And the most popular and widely used search engine is Google.

Using Google Trends we can examine how people from all over the world are searching. With Trends we will be able to see how often a particular search-term is entered that is relative to the total search-volume across various regions of the world and in various languages. Trends is like having your finger on the pulse of the world.

Our interest  in the popularity of Miley Cyrus, Justin Bieber and Beyonce can be easily looked at in Trends. A graph is returned charting the amount of searching of the three over the last ten years. Below the graph is where you can see the regional interest of each of them. This is important since it is also important to teach our students more of a global perspective on the topics that they are searching for.

The graph is interactive, so as you mouse-over it you are given a month-by-month account of each of the three artists’ search-volume. It gets particularly interesting in April 2008 when Miley Cyrus’ graph spikes for the first time. The graph doesn’t tell you why, it just gives you a date. This gives students the chance to figure it out on their own. It’s a digital puzzle that they get to put together themselves. What happened in April 2008 that caused her to jump in searches, or in February 2011 when Justin Bieber spiked to 100? That’s the students job to piece it all together.

Our Question Has Led to More Questions

After having the students look at their question through the Google Trends lens we are left with more questions than answers. Why did Justin Bieber spike? What happened in the summer of 2013 to make Miley’s search go through the roof? Why did Beyonce’s global interest begin to grow in the first half of 2008?

I haven’t answered the first question yet, remember, the who is more popular one? What I’ve done is added even more questions to my original question. Our inquiry is only beginning. It’s time that we introduce a Google Spreadsheet to the fun.

Data Collection Made Collaborative

We need a place to organize our data. On our Gsheet I have created a tab for each of the 3 artists. The students will work collaboratively to identify and collect the dates of a significant trend. That is when an artist sees an increase, or decrease, in searches. If an artist sees a rise in searches from the previous month we will color code the column green. If they see a decrease we will use red. This will give students an easier way to visualize their data. Once they have compiled their data in their GSheet it will be time to begin piecing the puzzle together.

Researching Credible Sources

Since this project has more to do with pop culture it might be best to use a credible newspaper, or magazine as our primary source of information. Students will use advanced searching techniques in Google to search for this information from credible sources only. They will use their GSheet to log the data that they research and provide a link back to the credible source.

As credible sources for this inquiry we will use the Los Angeles Times (LATimes.com) and the New York Times (NYTimes.com).

We will use a Google Site Advanced Search to search for our data on only those two specific sites. Since we want to find credible data and then corroborate that data with another credible source we may need to use a 3rd site just incase we can’t corroborate our data between the LA and NY Times.

Advanced Site Search

Once the students have identified some data to search for they will use Google to search only the LA and NY Times. To accomplish this they use an advanced search function know as a Site search.

Type – Justin Bieber site:latimes.com – into the Google search box. Once the results load use the Search Tools to search by a specific date range.

This will return all mentions of Justin Bieber from the month of November, 2009, the first month that he begins to see an increase in his search-volume. In the results that are returned we learn that the Bieber’s appearance at a Long Island, New York mall caused a near riot and led to the police arresting somebody. Could this be the first moment where Bieber-mania was born?

Remember when I said that we may need a third site to search? Well in May, 2010 the Bieber sees a huge spike in his search-volume when he reaches 91. Searching both the LA and NY Times didn’t return any significant reason. I selected YouTube as my third site. YouTube is the 2nd most used search engine behind Google. When I searched YouTube with the string Justin Bieber in May 2010 I am greeted with the reason why we saw his spike. The Bieber was making the rounds on all of the major talk shows, including Oprah, Ellen and American Idol. The Bieber has hit the big times.

The Big So What?

While the topic we are researching isn’t scholarly, the methods that we are using are. This example that I am using was designed more for the upper/high school level student. But there are plenty of ways to modify it so that even our youngest students can begin to understand how searching works.

The World’s Favorite Color? – A great way to get our young students thinking about search and the world in which they live. This is also an amazing way to introduce graphs to our young learners. Teachers using this activity can ask inquiry-driven questions like what is the most popular searched for color and why might that be? Why is red so popular in the United States, and Green so popular in China? I don’t have the answer to these questions. But I can think of some advanced searches that I would use to begin finding out with my students. And for students learning how to write, why not use a Google Document to have them make predictions and write down their answers after you’ve taken them through a few advanced searches.

The World’s Most Popular Form of Government – Here’s a way to get students thinking globally about more than just one form of government. Inquiry-driven questions to begin asking are; why is socialism so popular in Cuba? Why isn’t democracy a widely searched term in the United States, but is in Bhutan? What happened in November, 2008 when democracy spiked to 100 and become more popular than socialism in searches for the first time?

These inquiry-driven questions can also be great jumping off points into students conducting research into various countries and dates in modern history.

Wrapping it Up

There is a lot to sink your teeth into here and you can literally spend hours playing in Google Trends comparing different search terms with each other and checking to see what is trending in other countries. This is why learning how to search is so important to learn and thus teach to our students. It’s kind of exciting, and a little scary, to think about just how much we can begin to learn just by seeing what people are searching for.

And if you thought that the Bieber, Beyonce and Cyrus example wasn’t very academic then I invite you to consider this. As you have students look over their data and compare the dates of search-volume spikes to the data they collect on what happened on those dates a very clear picture will begin to form. That picture will teach your students more about digital leadership, and responsibility than any canned lesson that is contained on one of those websites that is dedicated to the topic. The reason, the students use inquiry-driven research to piece together a very clear puzzle that they are able to draw their own conclusions from. That’s powerful learning through powerful researching that just can’t be done by watching a video. I invite you to see if you and your students can put that puzzle together for themselves.

Works Cited

Halavais, Alexander. Search engine society. John Wiley & Sons, 2013.

Jonassen, David H. Meaningful learning with technology. Pearson/Merrill Prentice Hall, 2011.